


ABSTRACT
Asthma and chronic obstructive pulmonary disease (COPD) are among the most prevalent lung diseases. In both asthma and COPD, airway inflammation leads to airway remodeling. Parenchyma of the lung is also influenced by disease conditions. Airway wall thickening/ lumen narrowing and parenchymal destruction occur in COPD. In asthma, airway remodeling contributes to the lung parenchyma.
Computed tomography (CT) has been widely used as an imaging tool for lung diseases. With the technical advancement of CT, together with the development of analysis software, it is now possible to analyze the lung parenchymal change and airway remodeling quantitatively using CT. This article reviews the role of CT in assessing the lung structure and functions of patients with asthma and COPD.
KEY WORDS
airway remodeling, asthma, chronic obstructive pulmonary disease (COPD), computed tomography (CT), parenchymal lung disease
INTRODUCTION
Asthma and chronic obstructive pulmonary disease (COPD) are among the most prevalent lung diseases, and these conditions contribute an enormous burden of morbidity in Japan and globally.1-3 The pathophysiologic mechanisms underlying asthma and COPD are shown in Figure 1, 2.4 In both disorders, environmental factors such as allergens, viruses, and bacteria as well as personal, occupational, and atmospheric pollution cause an exaggerated immune/ inflammatory response in genetically susceptible individuals. The inflammatory response leads to airway remodeling, which contributes to airway narrowing.4 In asthma, although there is no destruction of lung parenchyma, air trapping due to small airways influences the lung density assessed by computed tomography (CT).5 In COPD, lung parenchyma is destroyed by inflammatory processes due to noxious gases, and the lung density is reduced showing low attenuation areas (LAAs).6,7 With technical advances in CT together with the development of analytical software, there is increasing interest in the radiological assessment of asthma and COPD patients. In this article, we describe the role of CT in the assessment of structure and functions in patients with asthma and COPD.
AIRWAY ASSESSMENT IN ASTHMA
Asthma is characterized by chronic airway inflammation which leads to airway remodeling and airway wall thickening.5 A number of studies have shown that the airway wall thickness in asthmatic patients is increased, regardless of the severity of the disease.8-13 The degree of airway wall thickening has been shown to be related to the duration of the disease, severity of disease, or the level of the airflow limitation.10-14 Niimi and colleagues have shown that the thickness of the right apical segmental bronchus, adjusted for body surface area, increases as a function of the duration of diagnosed asthma.14 Niimi et al. also showed that the airway wall area, corrected by body surface area, was increased in relation to the severity of the diseases (Fig. 3)
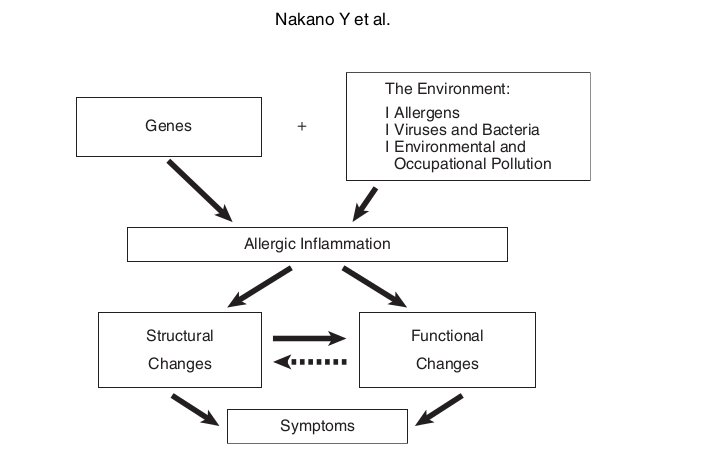
Fig. 1 Pathophysiologic schema for the development of asthma. Adapted from Nakano et al 4
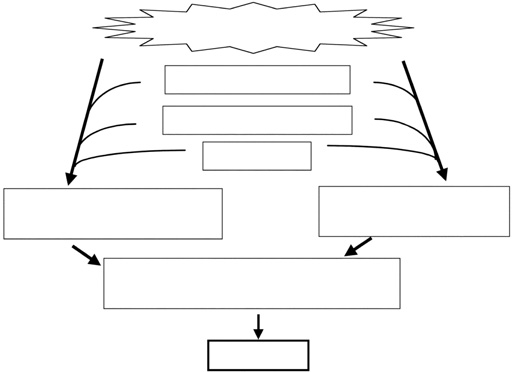
Fig. 2 Pathophysiologic schema for the development of COPD. Adapted from Nakano et al 4
The bronchial lumen area assessed using CT has been shown to be both decreased and increased.15,16 In patients with asthma, most of the bronchi have normal or decreased internal diameters; however, in approximately 30-40% of adult patients with uncomplicated asthma, one or more bronchi are dilated.15 Lynch et al. reported that 77% of asthmatic patients and 153 (36%) of 429 bronchi assessed in asthmatic patients had an internal bronchial diameter to pulmonary artery diameter ratio > 1.0, indicating dilatation of the bronchus and/or bronchiectasis.16
There are also a number of reports that compare the luminal area of asthmatics with that of normal subjects. Niimi et al. measured the right apical upper lobe bronchus and found that there was no decrease in luminal area in asthmatics compared with that in normal subjects.10 However, Beigelman-Aubry et al. reported that the bronchial cross-sectional areas were significantly smaller than that in healthy volunteers.17
Okazawa et al. demonstrated that the degree of airway narrowing produced by inhaled methacholine in asthmatics was the same as that in normal subjects.8 However, the same degree of narrowing was achieved using a much lower dose of methacholine in asthmatics than that in normal subjects. Goldin et al. also used methacholine to show a greater decrease in FEV1 and in the cross-sectional area of small (<5 mm2) airways in asthmatics compared to those in normal subjects.18 This controversy may be somewhat explained by the heterogeneity of airway response. Using methacholine, King et al. reported that airway narrowing is heterogeneous in the large airways of asthmatics and normal subjects, and that this heterogeneity is larger than that in control subjects.
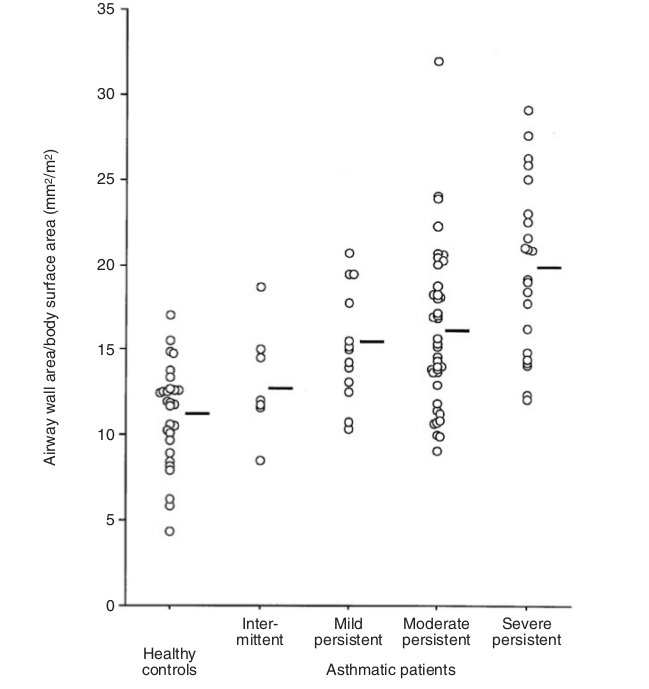
Fig. 3 The distribution of wall area/body surface area in the control and four asthmatic groups. Bars represent means. The difference among groups was significant. Adapted from Niimi et al 10
Furthermore, there is also a report showing considerable regional heterogeneity in airway wall thickness in the same individual.13
There are some reports that evaluated the relationship between CT assessment of the airway wall thickness and pathological measurements.12,13 Kasahara et al. showed that the indices of airway wall thickness on high-resolution CT (HRCT) scan (the ratio of wall area to total airway area, and the ratio of wall thickness to ideal luminal diameter) correlated with the measurements of the thickening of the epithelial reticular basement membrane obtained by bronchial biopsy.12 Recently, Aysola and colleagues used multidetector-row CT (MDCT) scans to demonstrate that the airway epithelial thickness measure on the biopsy sample correlated with the ratio of airway wall thickness to total airway diameter.13
Therapeutic effect was also evaluated using CT.14,20,21 Niimi et al. reported that 800 μg of inhaled beclomethasone per day for 12 weeks resulted in a significant decrease in the thickness of the right apical segmental bronchus, although the decrease did not return to the airway dimensions of an age- matched asymptomatic control group.14 Lee et al. reported that bronchial wall thickness was decreased significantly both in near-fatal asthma (NFA) and nonNFA groups after long-term (>6 months) treatment with inhaled corticosteroids.20 Kurashima et al. also used CT to evaluate the efficacy of inhaled corticosteroid (ICS) therapy and found that post ICS treatment, airway wall thickness decreased in patients with a duration of symptoms less than 3 years, and a minor response was seen in patients with a duration of symptoms ranging from 3 to 5 years. However, there was no change in airway wall thickness in patients with asthma for more than 5 years.21
PARENCHYMAL ASSESSMENT IN ASTHMA
In contrast to the airway, there are a limited number of studies that evaluate lung parenchyma in asthmatic patients by HRCT. The reason is that most asthmatic patients do not demonstrate parenchymal abnormalities during the stable stages. Asthma is mainly a small airway obstructive disease; however, it may manifest some parenchymal abnormalities such as centrilobular micronodules, mosaic perfusion and airtrapping in terms of chest CT.22 These observations have been evaluated using CT.9,17,23-25
Laurent et al. evaluated lung abnormalities in 22 patients with stable moderate asthma and compared with 12 healthy non-smokers and 10 healthy smokers by HRCT.24 They found that the mosaic perfusion pattern at full inspiration was observed in 23% of asthmatics but not in normal controls. Mosaic perfusion in asthma was probably due to hypoxic vasocontriction or changes in regional lung inflation due to small airway obstruction. They also found that air-trapping scores in the independent zones were significantly higher in asthmatic patients and healthy smokers than in healthy non-smoking people. In asthmatic patients, air-trapping scores correlated with FEV1 and FEF25-75%. This parenchymal abnormality was also attributed to small airway obstruction in asthmatics. Other parenchymal abnormalities (centrilobular micronodules, emphysema) were not detected in all these asthmatic patients.
Using HECT, Ueda et al. evaluated mean lung density and LAA% (the ratio of LAAs to corresponding lung area) at full inspiration and full expiration in 29 stable asthmatic patients.25 They found that the mean lung density increased (from −886 HU to −769 HU) and LAA% decreased (from 19.3% to 2.2%) in all patients during the expiratory phase compared with that during the inspiratory phase. Expiratory/inspiratory (E/ ratios of LAA% and mean lung density I) (MLD) correlated with disease severity, residual volume/total lung capacity (a functional measurement of air trapping), and airway sensitivity, as well as with FEV1, FEV1/FVC and FEF25-75%.
The E/I ratio of LAA% or MLD might reflect the degree to which fully inhaled air is effectively exhaled at full expiration or the degree of air trapping, a dynamic phenomenon occurring in the lungs of patients with asthma because of small airways abnormalities.
CT has also been used for the evaluation of asthma treatment. Goldin et al. used CT to compare the therapeutic effect between an extra-fine beclomethasone dipropionate inhaler ( hydrofluoroalkane- beclomethasone dipropionate [HFA-BDP]) and a conventional chlorofluorocarbon preparation (CFC- BDP).26 Regional gas trapping assessed by CT demonstrated that HFA-BDP showed a significant decrease in gas trapping after four weeks of treatment.
Mitsunobu and colleagues evaluated the therapeutic effect in asthma using both MLD and the relative lung area with an attenuation of <−950 HU (RA950).27 They found that both MLD and RA950 changed significantly with administration of systemic glucocorticoid therapy. Changes in forced expiratory volume in one second correlated significantly with those in both MLD and RA950.
Another method of evaluating the heterogeneity in asthmatic patients has also been reported. Mitsunobu et al. used a power low analysis (fractal analysis) to determine exponent D as a surrogate of the complexity of the terminal airspace geometry.28 They also used LAA% and found that LAA% differed significantly between moderate and mild asthma, but D did not. In mild and moderate asthma, a highly significant correlation between LAA% and D was observed in patients with a smoking history, but not in nonsmoking subjects with asthma. They concluded that decreased D is mostly related to emphysematous change, and both measurements of LAA% and D may provide useful information to characterize low attenuation areas in subjects with asthma.
AIRWAY ASSESSMENT IN COPD
It has been reported that the important site of airflow obstruction in COPD is the small airways.29-31 Despite technical advances in CT, the data obtained by routine clinical scanning contain large errors in terms of airway measurement.32 To determine whether the dimensions of relatively large airways assessed using computed tomography reflect small airway dimensions measured histologically, Nakano et al. assessed airway dimensions in non-obstructed or mild to moderately obstructed patients following lobar resection for peripheral tumor.33 They conclude that CT measurements of airways with an internal perimeter (Pi) of 0.75 cm or more could be used to estimate the dimensions of the small conducting airways, which are the site of airway obstruction in chronic obstructive pulmonary disease. These data suggest, at least for COPD, that airway dimensions in the larger bronchi could be used as surrogates for small airway dimensions.
Nakano et al. measured the lung attenuation and trunk of the apical bronchus of the right upper lobe in 114 smokers.34 They chose this bronchus because it is usually cut in cross-section and can be reliably identified on CT, thereby allowing comparison between individuals. They found that the LAA% and airway dimensions (the ratio of airway wall thickness to total diameter (T/ ratio) and the percentage wall D area [WA% = (WA/ Ao) × 100])8,11,35 independently correlated with measures of airflow obstruction. WA% correlated with FEV1 % predicted, forced vital capacity (FVC) % predicted and residual volume (RV)/ total lung capacity (TLC), but not with lung diffusing capacity.34 Interestingly, the airway wall area increased and lumen area decreased in COPD patients while the airway area increased and lumen area did not show any change in asthmatic patients.10,34 A different pattern of remodeling shown by these two studies may reflect fundamental differences in the inflammatory processes in asthma and COPD and could influence the reversibility of narrowing.4 Patel et al. investigated index cases of COPD and their smoking siblings, and reported a similar result in a large group (1,159 CT scans).36 They found that the airway wall thickness correlated with pack-years smoked and symptoms of chronic bronchitis. They also found that there was independent familial aggregation of both the emphysema and airway disease phenotypes of COPD.
Berger et al. used CT to compare airway wall thickness in nonsmokers with normal lung function to that in smokers with and without COPD.37 They demonstrated that in vivo normalized airway wall thickness was larger in smokers with COPD than it was in smokers or nonsmokers without COPD. Orlandi et al. studied 42 COPD patients (20 with and 22 without chronic bronchitis [CB]) and found that patients with CB had a significantly higher WA% and significantly lower LAA% than patients without CB.38 They concluded that bronchial wall measurements differ between patients who have COPD with CB and those who have COPD without CB.
Hasegawa et al. analyzed 52 patients with clinically stable COPD.39 They firstly used three-dimensional computed tomography to evaluate the airway dimensions from the third to sixth generations of the apical bronchus (B1) of the right upper lobe and anterior basal bronchus (B8) of the right lower lobe. They found that airway luminal area and WA% were significantly correlated with FEV1 (% predicted) and the correlation coefficients improved as the airways decreased in size from the third (segmental) to sixth generations in both bronchi.39
Matsuoka and colleagues used inspiratory and expiratory multislice CT to analyze the relationship between airflow limitation and airway dimensions from the third to the fifth generation of bronchi in 50 COPD patients.40 They found that airway lumen measured at expiratory CT was more closely related to expiratory airflow measurements than lumen measured at inspiratory CT. In addition, the changes in airway luminal area between inspiration and expiration were strongly related to airflow limitation.
Ohara et al. investigated the annual changes in airway dimensions and lung attenuation using CT in patients with COPD.41 They evaluated airway dimensions of the basal segment bronchi and lung attenuation on CT images in 38 patients. They found that annual changes in the percentage of wall area (WA%/ year) were inversely correlated with annual changes in FEV1, while annual changes in LAA% were not correlated with decline in FEV1.
Recently, Coxson et al. compared optical coherence tomography (OCT) measurements of airway dimensions with measurements assessed using CT scans and lung function.42 They found that there was a strong correlation between CT and OCT measurements of the lumen and wall area. They also found that OCT may be more sensitive in detecting small airway wall changes that lead to FEV1 changes in individuals with obstructive airway disease. The studies described above indicate that airway measurements using CT are a useful and sensitive method of evaluating airway wall thickening/ remodeling in vivo.
PARENCHYMAL ASSESSMENT IN COPD
Computed tomography is superior to chest radiography in demonstrating the presence, distribution, and extent of emphysema.43 There have been a large number of reports that evaluated the lung parenchymal change in COPD patients. In patients with COPD, LAAs have been reported to represent macroscopic and microscopic emphysematous changes in the lung.6,7,44-50 In a study of lung specimens, Hruban et al. assessed the degree of centrilobular emphysema radiologically on a visual grading system based on nonperipheral LAAs.44 They then compared the pathological grade of centrilobular emphysema with in vitro CT score and found a significant correlation (r = 0.91). Other studies have shown a correlation between in vivo HRCT assessment of emphysema and the pathological severity in the order of 0.7-0.9.45,48,51 Since visual assessment of emphysema on CT is time-consuming and intra/ interobserver variability is not negligible, an objective method using CT numbers (Hounsfield unit [HU]) has been applied.7,34,46,49,50,52-64 Most of the studies used a single threshold value as the cut-off level between the normal lung density area and LAA. The threshold value range has varied from −856 to −960 HU. Coxson et al. and Nakano et al. used 6.0 ml/ gram, which corresponds to −856 HU, and evaluated mild emphysema.52,62 Bae et al. used −900 HU,53 while others used −910 HU,7,54-56 −950 HU,46,49,56 or −960 HU.34,50,57-61,63,64 This discrepancy may be due to the differences between CT machines with different kinds of reconstruction algorithm or due to differences between conventional and high resolution CT scanning.
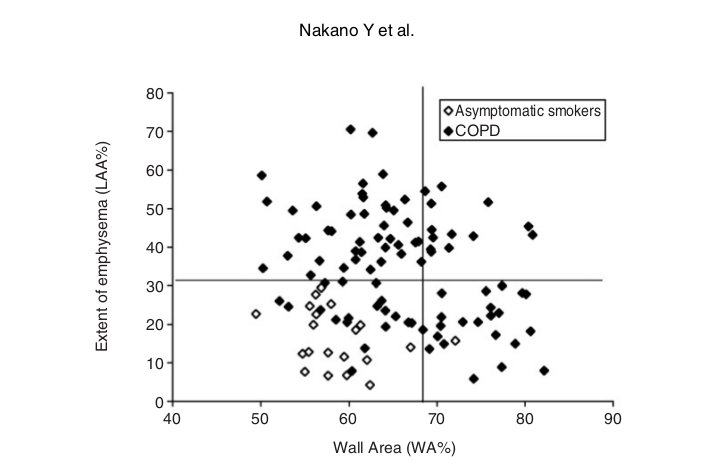
Fig. 4 Relationship between WA% and extent of emphysema (LAA%) in 94 COPD patients and 20 asymptomatic smokers. Horizontal line shows the mean +2SD of LAA% of the asymptomatic smokers. Vertical line shows the mean +2SD of WA% of the asymptomatic smokers. Using these cutoff values, COPD patients can be divided into groups; emphysema-dominant group (low WA% and high LAA%), and a mixed group (high WA% and high LAA%). Adapted from Nakano et al 4
It is reported that the sensitivity of HRCT in detecting early emphysematous change is low but its accuracy is higher than that of pulmonary function tests.43,55,65,66 However, there are many reports that have demonstrated significant relationships between CT indices and pulmonary function tests in COPD patients.39,56,57,60,63,67-72 The extent of emphysema (LAA%) in the whole lung correlated with pulmonary function tests including FVC% predicted, FEV1% predicted, FEV1/ FVC, RV/ TLC and DLCO/VA.34 The relationship between regional distribution of emphysema and pulmonary function tests has also been evaluated.55,62,63,73 Gurney et al. reported that patients with predominantly upper zone emphysema show near normal pulmonary function tests compared to that of those with predominantly lower zone emphysema.55 They also showed that the extent of emphysema in the lower lung zone showed higher correlations with DLCO than that in the upper lung zone, even though the upper lung zone had more emphysema.55 Other studies showed similar results.63,73 Nakano et al. reported that LAA% in the lower zone correlated better with FEV1/ FVC than LAA% in the upper zone.63 They also evaluated the core (inner) and rind (outer) distribution of emphysema and found that LAAs were more often found in the inner segment of the lung than in the outer segment, and the contribution of the inner segment to pulmonary function tests may be greater than that of the outer segment.63 This is in agreement with Haraguchi et al., who concluded that inner rather than outer emphysematous changes affect pulmonary function.73 Nakano et al. also used core and rind distribution of emphysema and evaluated the outcome of lung volume reduction surgery (LVRS) in COPD patients.62 They found that, although emphysema exists more in the core of the lung, a greater extent of severe emphysema in the rind of the upper lung predicts greater benefit from LVRS.62 The authors speculated that the analysis based on the core and rind distribution of emphysema identifies the lesions most accessible to removal by LVRS.
Knudson et al. reported the usefulness of expiration CT to evaluate emphysema. 74 However, Nishimura et al. showed that expiratory CT underestimates the degree of emphysema compared with that estimated by inspiratory CT.75 Gevenois et al. also reported that expiratory quantitative CT is not as accurate as inspiratory CT for quantifying pulmonary emphysema.49 The authors speculated that expiratory CT reflected air trapping more than reduction in the alveolar wall surface.49 Matsuoka et al. used paired inspiratory/ expiratory CT scans in a limited- lung area and found that paired inspiratory/ expiratory CT measurements in the limited-lung without emphysema correlated more closely with the pulmonary function tests.76 They also reported that the densitometric parameter of relative volume change calculated on paired inspiratory and expiratory MDCT using the threshold of −860 HU in limited lung correlated closely with airway dysfunction in COPD regardless of the degree of emphysema.77 The method using paired inspiratory/ expiratory CT scans may be better than that using expiratory CT alone.
Mishima et al. evaluated the size and numbers of LAAs using fractal analysis.60 They found that the cumulative size distribution of LAA clusters followed a power law characterized by exponent D. They also showed that D is a measure of the complexity of the terminal airspace geometry. This study suggested that D is a sensitive and powerful parameter for the detection of the terminal airspace enlargement that occurs in early emphysema.60
Nakano and colleagues evaluated 114 smokers (94 patients with COPD and 20 asymptomatic volunteers).34 They evaluated both airway dimensions (WA%) and emphysema (LAA%) using CT. They found that LAA% correlated significantly with FEV1, FEV1/ FVC, PEFR, RV/ TLC, and DLCO/ A but not V FVC. WA% correlated significantly with FVC, FEV1, PEFR, and RV/ TLC but not FEV1/ FVC or DLCO/ A. V They used multiple regression analysis and showed that FVC, FEV1, FEV1/ FVC, PEFR, and RV/ TLC were predicted better by a combination of LAA% and WA% than by LAA% or WA% alone. However, WA% did not add any predictive value to LAA% for DLCO/ VA.34 They concluded that both CT measurements of airway dimensions and emphysema are useful and complementary in the evaluation of the lung of smokers. Nakano et al. also found that they could divide COPD patients into groups who showed predominant loss of lung attenuation or thickening and narrowing of the apical segmental bronchus using LAA% and WA%.4 Although many subjects had both decreased lung attenuation consistent with emphysema and airway wall thickening, there were individuals with similar degrees of obstruction whose abnormalities appeared to be predominantly the result of airway remodeling and others in whom abnormalities appeared to be predominantly related to the loss of lung parenchyma. They used the mean +2 SD of LAA% in asymptomatic smokers and the mean +2 SD of WA% in asymptomatic smokers, and divided COPD patients into groups; airway remodeling-dominant group (high WA% and low LAA%), emphysema-dominant group (low WA% and high LAA%), and a mixed group (high WA% and high LAA%) (Fig.4).4 Ogawa et al. used the same approach for male smokers who have COPD and found that the body mass index (BMI) was significantly lower in those with a higher LAA% phenotype (i.e., emphysema dominant and mixed phenotypes).71 They also found that BMI correlated with LAA% but not with WA%, and that BMI was significantly lower in the emphysema dominant phenotype than in the airway dominant phenotype. They concluded that a low BMI is associated with the presence of emphysema, but not with airway wall thickening.71 Other researchers also used CT to find the relationship between emphysema and BMI.
CONCLUSIONS
CT has been widely used as an imaging tool for lung diseases. However, as described here, it is possible to analyze the lung parenchyma and airways quantitatively using digital data from CT. The information derived from CT data may be useful in clarifying the pathogenesis of lung diseases. The relationships between CT indices and biomarkers of inflammation and repair in blood, bronchoalveolar lavage and exhaled breath condensate are important areas for additional investigation.83 Further studies are needed in this area.
Source hoihohaptphcm.org
Duc Tin Clinic
Tin tức liên quan
Performance diagnostique de l’interféron gamma dans l’identification de l’origine tuberculeuse des pleurésies exsudatives
A Mixed Phenotype of Airway Wall Thickening and Emphysema Is Associated with Dyspnea and Hospitalization for Chronic Obstructive Pulmonary Disease.

Radiological Approach to Asthma and COPD-The Role of Computed Tomography.

Significant annual cost savings found with UrgoStart in UK and Germany
Thrombolex announces 510(k) clearance of Bashir catheter systems for thromboembolic disorders
Phone: (028) 3981 2678
Mobile: 0903 839 878 - 0909 384 389