


Rationale: Quantitative computed tomography (CT) has been used to phenotype patients with chronic obstructive pulmonary disease (COPD). A mixed phenotype is defined as the presence of both airway wall thickening and emphysema on quantitative CT. Little is known about patients with COPD with the mixed phenotype.
Abstract
Rationale: Quantitative computed tomography (CT) has been used to phenotype patients with chronic obstructive pulmonary disease (COPD). A mixed phenotype is defined as the presence of both airway wall thickening and emphysema on quantitative CT. Little is known about patients with COPD with the mixed phenotype.
Objectives: To propose a method of phenotyping COPD based on quantitative CT and to compare clinically relevant outcomes between patients with COPD with the mixed phenotype and those with other CT-based phenotypes.
Methods: Each of 427 male smokers (187 without COPD, 240 with COPD) underwent a complete medical interview, pulmonary function testing, and whole-lung CT on the same day. The percentage of low-attenuation volume at the threshold of -950 Hounsfield units (%LAV) and the square root of wall area of a hypothetical airway with an internal perimeter of 10 mm (Pi10) were measured. Patients with COPD were classified into four distinct phenotypes based on the upper limits of normal for %LAV and Pi10, which were derived from the data of smokers without COPD by using quantile regression.
Measurements and Main Results: Of 240 patients with COPD, 52 (21.7%) were classified as CT-normal phenotype, 39 (16.3%) as airway-dominant phenotype, 103 (42.9%) as emphysema- dominant phenotype, and 46 (19.2%) as mixed phenotype. Patients with COPD with the mixed phenotype were associated with more severe dyspnea than those with each of the remaining CT-based phenotypes (P < 0.01 for all comparisons). The number of hospitalizations for COPD exacerbations during the preceding year was 2.0 to 3.6 times higher in patients with the mixed phenotype than in those with each of the remaining CT-based phenotypes (P < 0.05 for all comparisons). Findings persisted after adjustment for age, pack-years of smoking, smoking status, body mass index, and FEV1.
Conclusions: Patients with COPD with the mixed phenotype are associated with more severe dyspnea and more frequent hospitalizations than those with each of the remaining CT-based phenotypes. Thus, patients with COPD with the mixed phenotype may need more attention and interventions.
Keywords: airway remodeling; chronic obstructive pulmonary disease; computed tomography; quantitative imaging
Chronic obstructive pulmonary disease (COPD) is such a heterogeneous disease that FEV1 does not adequately reflect its complexity (1). Thus, investigators have used other modalities to classify patients with COPD into subgroups or phenotypes. Reproducible phenotypes may facilitate a greater understanding of the pathogenesis, therapeutics, and genetics of COPD (2–4). A COPD phenotype is a single or combination of disease attributeindividuals with COPD as they relate to clinically meaningful outcomes (symptoms, exacerbations, response to therapy, rate of disease progression, or death) (5). Established COPD phenotypes include a1-antitrypsin deficiency, chronic bronchitis versus emphysema (6), frequent exacerbation (7), and persistent systemic inflammation (8).
As a noninvasive modality to indirectly evaluate changes in pulmonary structure and function (9–11), quantitative CT has been used to phenotype patients with COPD (12, 13). Based on the extent of emphysema and airway wall thickness measured by quantitative CT, patients with COPD may be classified into CT-normal, emphysema- dominant, airway-dominant, and mixed phenotype (14). Patients with emphysema- dominant phenotype are associated with low body mass index (BMI) (14), severe dyspnea (15), rapid decline of FEV1 (16), and high respiratory-related mortality (17). Patients with airway-dominant phenotype are associated with frequent chronic cough (18) and frequent exacerbations (19). However, a crucial issue in previous studies is the lack of consensus about the upper limits of normal (ULNs) for both the extent of emphysema and the airway wall thickness. They are arbitrary (15, 16), equal to mean 1 2SD (14), equal to 20% quintile (17), or based on surface plots (19). Furthermore, although emphysema- and airway-dominant phenotypes have been studied extensively, studies of mixed phenotype are limited.
Because a mixed phenotype is defined as the presence of both airway wall thickening and emphysema (13), we hypothesized that patients with COPD with the mixed phenotype are associated with more frequent adverse clinical outcomes than those with each of the remaining CT-based phenotypes. The aims of conducting this study were to propose a method of phenotyping COPD based on quantitative CT and to compare clinically relevant outcomes between patients with COPD with the mixed phenotype and those with each of the remaining CT-based phenotypes. Some results of this study have been previously reported in the form of an abstract (20).
Methods
Study Design
This is a cross-sectional study, which was conducted at the University Medical Center s at Ho Chi Minh City, Ho Chi Minh, Vietnam and the Shiga University of Medical Science, Shiga, Japan. The study protocol was approved by the ethics committees of both institutions. Informed written consent was obtained from all participants.
Subjects with and without COPD were recruited at the Outpatient Respiratory Clinic of the University Medical Center at Ho Chi Minh City if they met all of the following criteria: male, age at least 40 years, and former or current cigarette smoker with a history of more than 10 pack-years. COPD was diagnosed according to the Global Initiative for Chronic Obstructive Lung Disease (GOLD) guidelines (21). Smokers without COPD were those with a post- bronchodilator ratio of FEV1 to FVC greater than or equal to 70% and a post- bronchodilator FEV1 % predicted greater than or equal to 80%. Subjects were excluded for any of the following reasons: female sex (COPD is rare in Vietnamese women), a history of asthma, COPD exacerbations within 6 weeks, chronic respiratory failure, and abnormalities on plain chest X-ray other than emphysema and/or minor linear opacities. Each participant underwent a complete medical interview, physical examination, collection of venous blood, pulmonary function testing, and chest CT on the same day.
Clinical Data
Participants were questioned following a standardized protocol to collect data on smoking history, clinical symptoms, the duration of COPD, medications used for COPD, and the number of hospitalizations for COPD exacerbations during 1 year before the study enrollment (hereafter abbreviated as the number of hospitalizations). The duration of COPD was calculated from the date of COPD diagnosed by a doctor to the date of study enrollment rounded to the whole year as a count variable. Those who had not been diagnosed by a doctor before the study enrollment were assigned a duration value of zero. Dyspnea severity was rated according to the modified Medical Research Council (mMRC) scale (grades 0–4). The number of hospitalizations was self-reported as a count variable. The number of COPD exacerbations during 1 year before the study enrollment was not collected because of concerns over recall bias and subjective interpretation of the exacerbations (22).
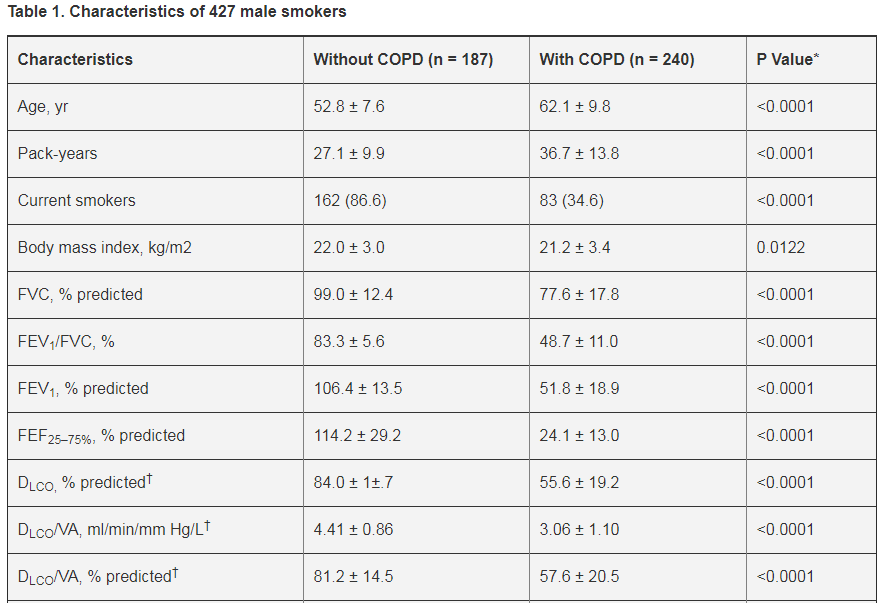
Definition of abbreviations: COPD = chronic obstructive pulmonary disease; DLCO = diffusing capacity of the lung for carbon monoxide; FEF25-75% = forced expiratory flow, midexpiratory phase;
HU = Hounsfield units; %LAV = the percentage of low attenuation volume at the threshold of -950
Hounsfield units; PD15 = the lowest 15th percentile point of whole-lung density distribution;
Pi10 = the square root of wall area of a hypothetical airway with an internal perimeter of 10 mm;
RV = residual volume; VA = alveolar volume.
Data are presented as mean 6 SD, n (%), or median (25th–75th percentiles).
*By Student t test, Wilcoxon test, or Chi-square test, as appropriate.
† Data from 185 smokers without COPD and 171 smokers with COPD.
‡ Data from 165 smokers without COPD and 232 smokers with COPD.
Pulmonary Function Tests
All participants underwent spirometry before and after inhaling 400 mg salbutamol, as previously described elsewhere (23). Diffusing capacity of the lung for carbon monoxide was measured by the helium dilution, single-breath method using EasyOne Pro (ndd Medizintechnik AG, Zurich, Switzerland). All maneuvers met the American Thoracic Society/European Respiratory Society standards (24, 25). The test of bronchodilator reversibility was classified as positive when FEV1 and/or FVC increase more than 200 ml and more than 12% after the inhalation of 400 mg salbutamol (26).
Quantitative CT Analysis
All participants were scanned using the same 64-slice CT scanner, Toshiba Aquillion 64 (Toshiba Corp., Tokyo, Japan), as previously reported (23). CT images were reconstructed with 1-mm slice thickness, 0.5-mm interval, 320-mm field of view, 512 x 512 matrix, and FC03 kernel.
All CT images were analyzed by using Apollo 1.2 software (VIDA Diagnostics, Coralville, IA; www.vidadiagnostics.com) at a laboratory of the Shiga University of Medical Science. The extent of emphysema for each patient was measured by density mask method (27). Emphysema was defined as the percentage of lung volume with CT attenuation value less than -950 Hounsfield units (HU) (28)—known as the percentage of low attenuation volume at the threshold of -950 HU (%LAV).
All visible bronchial segments up to the fifth generation—sub-subsegmental bronchi—were segmented automatically by the software, edited manually by observers, and measured automatically by the software. However, only segments with internal perimeters from 6 to 20 mm (23) were selected for estimating the square root of wall area of a hypothetical airway with an internal perimeter of 10 mm (Pi10)— a standardized index of airway wall thickness (29). Pi10 is calculated from the linear regression in which the square root of wall area of each measured segment is plotted against its internal perimeter (30).
CT-based Phenotypes
The ULNs for %LAV and Pi10 were derived from the data of smokers without COPD and defined as the 95th percentile (31) for each CT measure after adjusting for age and BMI. The 95th percentile was calculated using quantile regression with age and BMI included as independent predictors. Quantile regression models were derived from the “quantreg” package (32) for the R software (33). In this instance, quantile regression is preferred over standard linear regression because of its ability to model the shape of the distribution of CT measures (including percentiles) (34).
Smokers with COPD were classified into the four following phenotypes: CT-normal phenotype, %LAV ≤ ULN and Pi10 ≤ ULN; airway-dominant phenotype, %LAV ≤ ULN and Pi10 > ULN; emphysema-dominant phenotype, %LAV > ULN and Pi10 ≤ ULN; and mixed phenotype, %LAV > ULN and Pi10 > ULN.
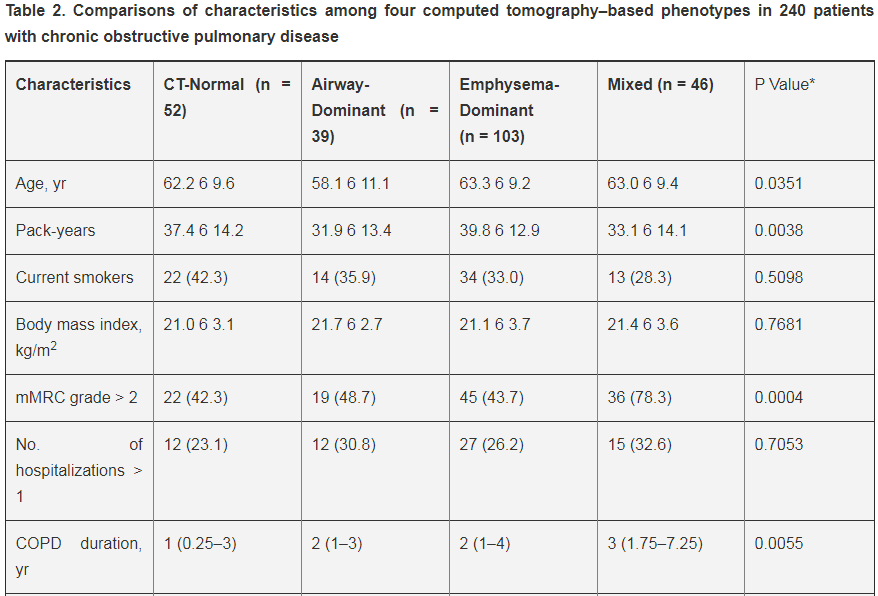
Definition of abbreviations: COPD = chronic obstructive pulmonary disease; CT = computed tomography; DLCO = diffusing capacity of the lung for carbon monoxide; FEF25–75% = forced expiratory flow, midexpiratory phase; mMRC = modified Medical Research Council; RV = residual volume; VA = alveolar volume.
Data are presented as mean 6 SD, median (25th–75th percentiles), or n (%), where appropriate.
*Comparisons among the four phenotypes by analysis of variance, Wilcoxon test, or Chi-square test, as appropriate.
† Data from 171 patients with COPD by helium dilution, single-breath method.
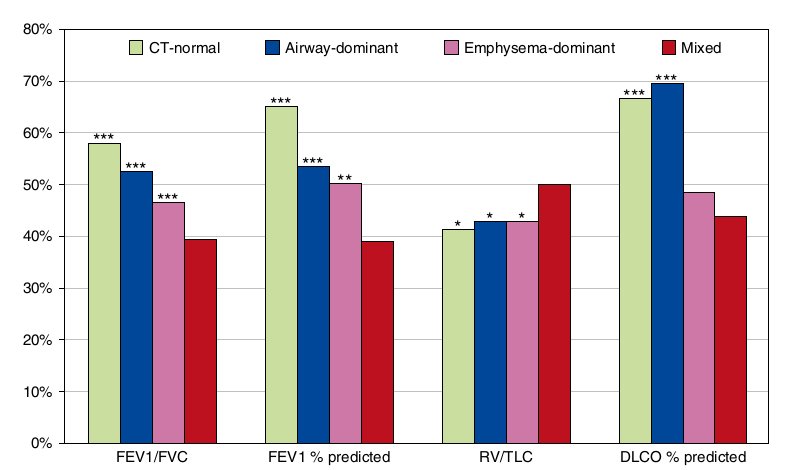
Figure 1 Comparisons of mean pulmonary function parameters between the mixed phenotype and each of the remaining computed tomography (CT)-based phenotypes. *P < 0.05, **P < 0.001, ***P <0.0001, versus the mixed phenotype by multiple linear regression in which the mixed phenotype was set as the reference; the remaining CT-based phenotypes were three dummy independent variables. DLCO = diffusing capacity of the lung for carbon monoxide; RV = residual volume.
Statistical Analysis
Differences in characteristics between smokers with and without COPD were examined by Student t test, Wilcoxon test, or a Chi-square test, as appropriate. Comparisons of patient characteristics among the four CT-based phenotypes were examined by analysis of variance, Wilcoxon test, or a Chi-square test. Comparisons of patient characteristics between the mixed phenotype and each of the remaining CT-based phenotypes were evaluated by multiple linear regression (patient characteristics were outcome variables, and the CT-based phenotypes were three dummy independent variables). Skewed continuous variables were log- transformed. Comparisons of mMRC dyspnea between the mixed phenotype and each of the remaining CT-based phenotypes were evaluated by ordinal logistic regression. All the above statistical analyses were done using JMP 9.0.2 (SAS Institute Inc., Cary, NC).
Comparisons of the COPD duration between the mixed phenotype and each of the remaining CT-based phenotypes were evaluated by negative binomial regression models derived from the “MASS” package (35) for the R software. Comparisons of the number of hospitalizations between the mixed phenotype and each of the remaining CT-based phenotypes were evaluated by zero-inflated Poisson regression, which accommodates excess zero counts (36). Zero-inflated regression models were derived from the “pscl” package (37) for the R software.
In each regression model of predicting mMRC dyspnea or the number of hospitalizations, because there are three comparisons between CT-based phenotypes, a P value less than 0.0167 is considered significant for a comparison after a Bonferroni correction for multiple testing.
Results
Study Population
Of 270 smokers with COPD recruited, 30 (11.1%) were excluded from the statistical analysis for noisy CT images (19 smokers) or lung abnormalities on CT images (11 smokers). Of the 240 remaining patients with COPD, 21 (8.8%) were classified as stage I, 105 (43.7%) as stage II, 88 (36.7%) as stage III, and 26 (10.8%) as stage IV according to the GOLD guidelines (21). Of 193 smokers without COPD recruited, 6 (3.1%) were excluded for noisy CT images (5 smokers) or lung abnormalities (1 smoker). The remaining sample for this report comprises 427 smokers.
Smokers with COPD were older, had higher pack-years, and had lower BMI than those without COPD (Table 1). As expected, all pulmonary function parameters were lower in smokers with COPD than in those without COPD. The airway wall thickness as assessed by Pi10 was thicker, and the extent of emphysema as assessed by %LAV and the lowest 15th percentile point of whole- lung density distribution was more severe in smokers with COPD than in those without COPD.
ULNs for CT Measures
The quantile regression equations for the 95th percentile used to calculate the ULNs for CT measures are shown below:
ULN for %LAV = 1.76384 + 0.01137 x Age - 0.07332 x BMI;
ULN for Pi10 = 3.59689 + 0.00219 x Age + 0.00300 x BMI.
Using these two equations, of the 187 smokers without COPD, 8 (4.3%) had emphysema because their observed %LAV exceeded a calculated ULN; 11 (5.9%) had airway wall thickening because their observed Pi10 exceeded a calculated ULN. Of the 240 smokers with COPD, 149 (62.1%) had emphysema and 85 (35.4%) had airway wall thickening.
Comparisons of Characteristics among CT-based Phenotypes
Based on the ULNs for %LAV and Pi10, of the 240 patients with COPD, 52 (21.7%) were classified as CT-normal phenotype, 39 (16.3%) as airway-dominant phenotype, 103 (42.9%) as emphysema-dominant phenotype, and 46 (19.2%) as mixed phenotype.
Patients with COPD with the emphysema-dominant phenotype were oldest and smoked the most (Table 2). However, patients with COPD with the mixed phenotype had the highest percentage of mMRC grade greater than or equal to 2, the lowest mean FEV 1 % predicted, the highest mean residual volume (RV)/TLC, and the highest blood neutrophil count. There were no differences in the percentage of patients with one or more hospitalizations, the percentage of patients with positive bronchodilator reversibility, and the concentration of C-reactive protein among the four CT-based phenotypes.
Mixed Phenotype and Adverse Outcomes
Patients with COPD with the mixed phenotype had more severe airflow limitation as assessed by FEV1/FVC and FEV1 % predicted and more severe air trapping as assessed by RV/TLC than those with each of the remaining CT-based phenotypes (Figure 1). The mean diffusing capacity of the lung for carbon monoxide percent predicted was lower in patients with COPD with the mixed phenotype than in those with the CT-normal phenotype (P < 0.0001) and in those with the airway-dominant phenotype (P< 0.0001).
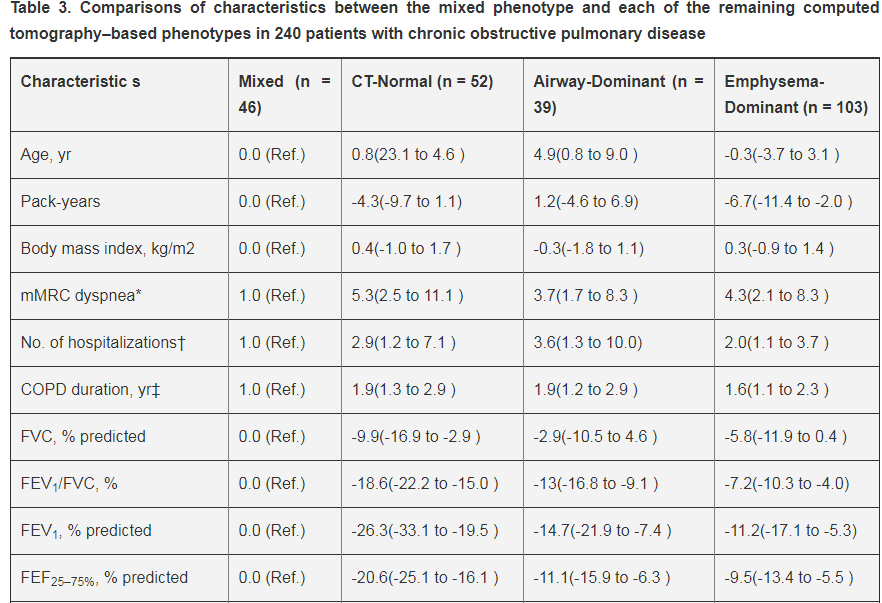
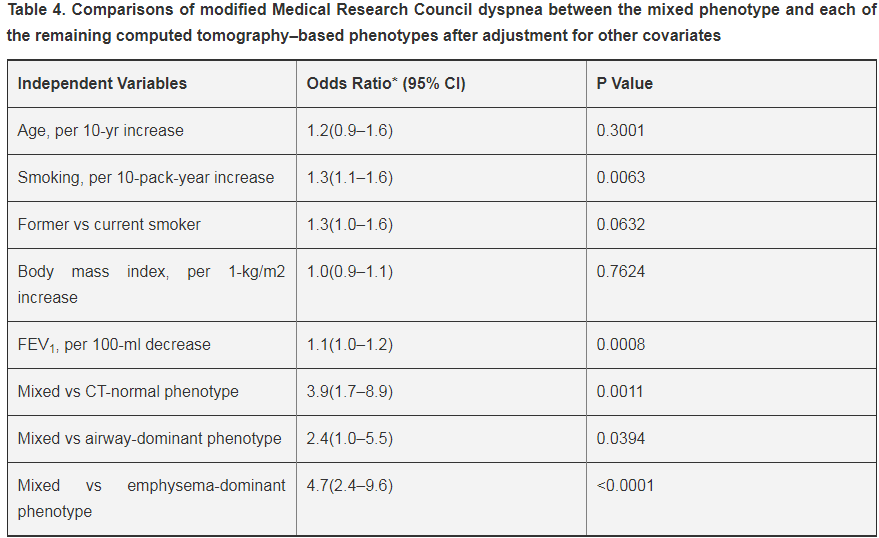
Patients with COPD with the mixed phenotype were associated with more severe dyspnea than those with each of the remaining CT-based phenotypes. At a specific mMRC dyspnea grade, the cumulative percentage of patients with COPD with the same or higher dyspnea grade in the mixed phenotype was 5.3-fold greater than that in the CT-normal phenotype (P < 0.0001), 3.7-fold greater than that in the airway-dominant phenotype (P = 0.0011), and 4.3-fold greater than that in the emphysema- dominant phenotype (P < 0.0001) (Table 3 and Figure 2). The differences remained significant for all comparisons (P <0.0167 for each comparison) even after a Bonferroni correction for multiple testing. The differences also persisted after adjustment for age, pack-years of smoking, smoking status, BMI, and FEV1 (Table 4).
Definition of abbreviations: CI = confidence interval; COPD = chronic obstructive pulmonary disease; CT = computed tomography; DLCO = diffusing capacity of the lung for carbon monoxide; FEF25–75% = forced expiratory flow, midexpiratory phase; mMRC = modified Medical Research Council; OR = odds ratio; RV = residual volume; VA = alveolar volume.
Data are presented as regression coefficient (95% CI) unless otherwise stated. Figures in boldface indicate significant differences between the mixed phenotype, which was set as the reference (Ref.), and the corresponding CT-based phenotypes (as three dummy variables).
*Data are OR (95% CI) by ordinal logistic regression; a higher OR indicates a higher cumulative percentage of patients with more severe dyspnea.
† Data are rate ratio (95% CI) by zero-inflated Poisson regression.
‡ Data are rate ratio (95% CI) by negative binomial regression.
x From 171 patients with COPD (19 for mixed, 40 for normal-CT, 27 for airway-dominant, and 85 for emphysema-dominant).
k The variable was log-transformed; data are OR (95% CI).
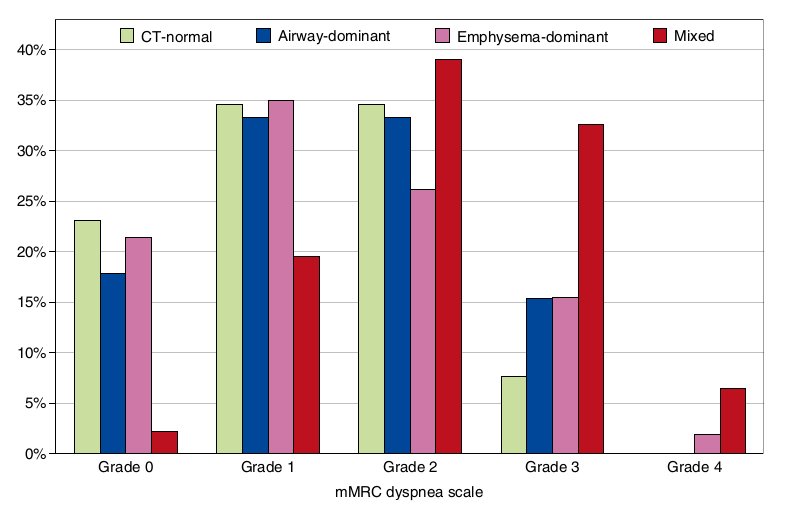
Figure 2. Distribution of percentages of patients with chronic obstructive pulmonary disease with different modified Medical Research Council (mMRC) dyspnea grades in each computed tomography (CT)-based phenotype.
Patients with COPD with the mixed phenotype were associated with more frequent hospitalizations than those with each of the remaining CT-based phenotypes. The number of hospitalizations was 2.9-fold higher in patients with COPD with the mixed phenotype than in those with the CT-normal phenotype (P = 0.0204), 3.6-fold higher than in those with the airway- dominant phenotype (P = 0.0128), and 2.0-fold higher than in those with the emphysema-dominant phenotype (P = 0.0164) (Table 3). The differences remained significant after a Bonferroni correction except for the comparison between the mixed and CT-normal phenotypes (P . 0.0167). After adjustment for age, pack- years of smoking, smoking status, BMI, and FEV1, the differences remained significant: the rate ratio was 3.3 (P = 0.0331), 3.4 (P = 0.0073), and 2.5 (P = 0.0063), respectively (Figure 3A; see Table E1 in the online supplement).
Patients with the mixed phenotype were associated with a longer COPD duration than those with each of the remaining CT-based phenotypes. The COPD duration was 1.9-fold longer in patients with the mixed phenotype than in those with the CT-normal phenotype (P = 0.0013), 1.9-fold longer than in those with the airway-dominant phenotype (P = 0.0062), and 1.6-fold longer than in those with the emphysema-dominant phenotype (P = 0.0055) (Table 3). After adjustment for age, the differences remained significant: the rate ratio was 1.9 (P = 0.0023), 1.7 (P = 0.0178), and 1.6 (P = 0.0045), respectively (Figure 3B).
Definition of abbreviation: CI = confidence interval; CT = computed tomography.
*By ordinal logistic regression. Note: A higher odds ratio indicates a higher cumulative percentage of patients with more severe dyspnea. For example, if FEV1 decreased 100 ml, the cumulative percentage of patients with more severe dyspnea increased by a factor of 1.1. After adjustment for other covariates, at a specific modified Medical Research Council dyspnea grade, the cumulative percentage of patients with chronic obstructive pulmonary disease with the same or higher dyspnea grade in the mixed phenotype was 3.9-fold higher than that in the CT-normal phenotype, 2.4-fold higher than that in the airway-dominant phenotype, and 4.7-fold higher than that in the emphysema- dominant phenotype. The only comparison that did not remain significant after a Bonferroni correction was the mixed vs airway-dominant phenotypes (P > 0.0167).
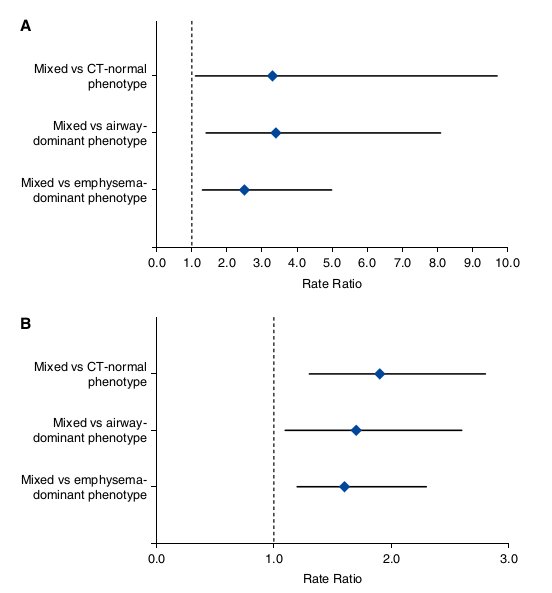
Figure 3. Forest plots for comparisons of the number of hospitalizations (A) and the chronic obstructive pulmonary disease duration (B) between the mixed phenotype (set as the reference) and each of the remaining computed tomography (CT)-based phenotypes. (A) Data are rate ratio (95% confidence interval [CI]) after adjustment for age, pack-years of smoking, smoking status, body mass index, and FEV1 by zero-inflated Poisson regression. (B) Data are rate ratio (95% CI) after adjustment for age by negative binomial regression.
Table 3 also shows that the blood neutrophil count was 1.3-fold higher in patients with COPD with the mixed phenotype than in those with the CT-normal phenotype (P = 0.0132) and 1.3-fold higher than in those with the airway-dominant phenotype (P = 0.0027).
The associations with either mMRC dyspnea or the number of hospitalizations were stronger for COPD phenotypes based on the ULNs for both %LAV and Pi10 than for those based on the ULN for either %LAV or Pi10 alone (Table E2). The associations with either mMRC dyspnea or the number of hospitalizations were stronger for CT-based phenotypes than for GOLD stages (Table E3).
Discussion
Based on the ULNs for %LAV and Pi10, patients with COPD were classified into four distinct phenotypes; one-fifth belonged to the mixed phenotype. The mixed phenotype of both emphysema and airway disease was associated with more frequent adverse clinical outcomes than those with each of the other CT-based phenotypes. The mixed phenotype was additionally associated with more severe airflow limitation (29, 38), worse dyspnea, and worse prognosis based on the multidimensional BODE index (39). The finding that patients with COPD with the mixed phenotype had more severe air trapping (presented as elevated RV/TLC), which is synergistically contributed to by emphysema and airway remodeling, may explain some of the associations between the mixed phenotype and magnitude of symptoms independent of airflow limitation (40).
A particularly novel finding in the present study is that the mixed COPD phenotype was associated with a higher number of hospitalizations than other CT-based phenotypes. This finding is consistent with the finding from a previous study of visual (rather than quantitative) CT evaluation (41). This finding also extends the results from a prior study, which documented that the number of COPD exacerbations increased proportionately with Pi10 and %LAV in a subgroup of patients with %LAV greater than 35% (19).
Because this is a cross-sectional study, it is hard to explain why patients with the mixed phenotype reported a longer duration of COPD than patients with other CT-based phenotypes. Longer duration may be required for both emphysema and airway remodeling to develop and progress over time (9). Another possible explanation is that because patients with the mixed phenotype have more severe dyspnea than patients with other phenotypes, they tend to seek medical attention earlier and consequently are diagnosed with COPD earlier by a doctor. One might then raise another question: Why did they have a higher number of hospitalizations, even though they had received medical attention earlier? The answer to that question might be related to a vicious circle: intrinsic structural changes in the lungs of patients with the mixed phenotype may facilitate repeated exacerbations; repeated hospitalizations, in turn, perpetuate these structural changes (42). This theory is supported by the fact that patients with the mixed phenotype have higher blood neutrophil count, which has been associated with repeated exacerbations (43). There is also evidence that COPD exacerbations are associated with emphysema progression (44).
To the best of our knowledge, we are the first to phenotype COPD on the basis of the ULNs for CT measures calculated as the 95th percentile from quantile regression models. By modeling the data of smokers without COPD with quantile regression, the ULN was adjusted for age and BMI. Other confounders that affect CT measures (45) can be easily added to the quantile regression models to refine the ULNs. Furthermore, deriving the ULNs from quantile regression models is suitable in most clinical and research settings because quantile regression can easily model the shape of the distribution of CT measures as they change with confounders (34). Another strong point of the present study is that patients with COPD were classified on the basis of structural changes evaluated by using one modality—quantitative CT (46). This method of phenotyping COPD has potential applications because it is intuitive and practical to test a priori hypotheses; it avoids spurious selection of variables (47), which is a serious limitation of the methods used in previous studies (48–50).
In spite of the above advantages, this study also has some limitations. First, Pi10 is not the standard for evaluating airway remodeling in COPD; there are several alternate CT measures, such as wall area percent of a certain bronchus (51), wall area by anatomical names (52), and wall area of spatially matched airways (53). However, we chose Pi10 to define the airway-dominant phenotype because it is adjusted for lumen area (29), which is critical to airway resistance in COPD (54); it is associated with wall thickening of the small airways measured by histology (30). Second, because smokers without COPD were skewed to the younger age, the ULNs for %LAA and Pi10 derived from them might overestimate the prevalence of emphysema and airway wall thickening in smokers with COPD. However, the prediction equations of the ULNs are deemed suitable because the age range of smokers without COPD (40–83 years) is nearly the same as that of smokers with COPD (40–88 years). Third, the ULNs for CT measures are derived from smokers without COPD, not from healthy nonsmokers. However, the ULNs of smokers without COPD may be the same as those of healthy nonsmokers, given that smokers without COPD are relatively resistant to cigarette smoke (55). Fourth, because this is a cross-sectional study, the roles of the proposed CT-based phenotypes in guiding therapy or predicting mortality need to be validated in longitudinal studies. Finally, because we enrolled only male smokers at an institution, one should be cautious to generalize findings of the present study to female smokers or to other COPD populations.
In conclusion, patients with COPD with the mixed phenotype are associated with more severe dyspnea and more frequent hospitalizations than those with each of the remaining CT-based phenotypes.
Author disclosures are available with the text of this article at www.atsjournals.org.
Acknowledgment: The authors thank staff members of the Respiratory Care Center, University Medical Center at Ho Chi Minh City for recruiting the subjects for this study. They also thank Prof. Robert D. Abbott, Ph.D., Center for Epidemiologic Research in Asia, Shiga University of Medical Science, for advising on the statistical analysis and for checking the written English of the manuscript.
Source hoihohaptphcm.org
Duc Tin Clinic
Tin tức liên quan
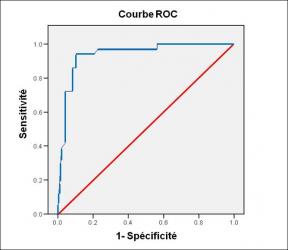
Performance diagnostique de l’interféron gamma dans l’identification de l’origine tuberculeuse des pleurésies exsudatives

A Mixed Phenotype of Airway Wall Thickening and Emphysema Is Associated with Dyspnea and Hospitalization for Chronic Obstructive Pulmonary Disease.
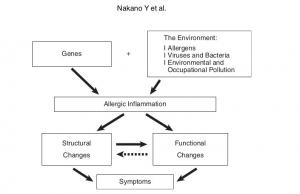
Radiological Approach to Asthma and COPD-The Role of Computed Tomography.

Significant annual cost savings found with UrgoStart in UK and Germany
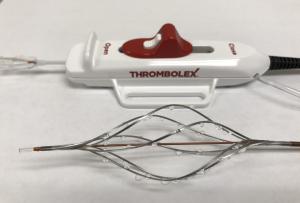
Thrombolex announces 510(k) clearance of Bashir catheter systems for thromboembolic disorders
Phone: (028) 3981 2678
Mobile: 0903 839 878 - 0909 384 389